Thursday, July 3, 2025, 11:41 PM
Site: Learnbps
Class: BPSS (MAT) Mathematics Standards (S-MAT)
Glossary: MAT-HS: Statistics and Probability
MAT-HS.S-ID.01
|
MAT-HS Targeted Standards
(S) Concept: Statistics and Probability
(ID) Domain: Interpreting Categorical and Quantitative Data
Cluster: Summarize, represent, and interpret data on a single count or measurement variable
MAT-HS.S-ID.01 Represent data with plots on the real number line (dot plots, histograms, and box plots).
|
Student Learning Targets:
Knowledge Targets
- I can choose an appropriate display to represent a set of data.
Reasoning Targets
- I can analyze a set of data.
Skills (Performance) Targets
- I can collect an appropriate set of data.
Product Targets
- I can construct a graph to represent a set of data.
- I can construct dot plots, histograms and box plots on a real number line.
|
Proficiency Scale
| Score |
|
Description |
Sample Activity
|
| 4.0 |
In addition to Score 3.0, the student demonstrates in-depth inferences and applications regarding more complex material that go beyond end of instruction expectations. |
- |
| |
3.5 |
In addition to Score 3.0 performance, the student demonstrates in-depth inferences and applications regarding the more complex content with partial success. |
| 3.0 |
“The Standard.” The student demonstrates no major errors or omissions regarding any of the information and processes that were end of instruction expectations. |
- |
| |
2.5 |
The student demonstrates no major errors or omissions regarding the simpler details and processes (Score 2.0 content) and partial knowledge of the more complex ideas and processes (Score 3.0 content). |
| 2.0 |
The student demonstrates no major errors or omissions regarding the simpler details and processes but exhibits major errors or omissions regarding the more complex ideas and processes (Score 3.0 content). |
- |
| |
1.5 |
The student demonstrates partial knowledge of the simpler details and processes (Score 2.0 content) but exhibits major errors or omissions regarding the more complex ideas and procedures (Score 3.0 content). |
| 1.0 |
With help, the student demonstrates a partial understanding of some of the simpler details and processes (Score 2.0 content) and some of the more complex ideas and processes (Score 3.0 content). |
- |
| |
0.5 |
With help, the student demonstrates a partial understanding of some of the simpler details and processes (Score 2.0 content) but not the more complex ideas and processes (Score 3.0 content). |
| 0.0 |
Even with help, the student demonstrates no understanding or skill. |
- |
Resources
|
Web
|
|
Vocab
- dot plot
- histogram
- box plot
|
|
|
MAT-HS.S-ID.02
|
MAT-HS Targeted Standards
(S) Concept: Statistics and Probability
(ID) Domain: Interpreting Categorical and Quantitative Data
Cluster: Summarize, represent, and interpret data on a single count or measurement variable
MAT-HS.S-ID.02 Use statistics appropriate to the shape of the data distribution to compare center (median, mean) and spread (interquartile range, standard deviation) of two or more different data sets.
|
Student Learning Targets:
Knowledge Targets
- I can use the correct measure of center and spread to describe a distribution that is symmetric or skewed.
Reasoning Targets
- I can compare two or more different data sets using the center and spread of each.
Skills (Performance) Targets
- I can describe a distribution using center and spread.
Product Targets
|
Proficiency Scale
| Score |
|
Description |
Sample Activity
|
| 4.0 |
In addition to Score 3.0, the student demonstrates in-depth inferences and applications regarding more complex material that go beyond end of instruction expectations. |
- |
| |
3.5 |
In addition to Score 3.0 performance, the student demonstrates in-depth inferences and applications regarding the more complex content with partial success. |
| 3.0 |
“The Standard.” The student demonstrates no major errors or omissions regarding any of the information and processes that were end of instruction expectations. |
- |
| |
2.5 |
The student demonstrates no major errors or omissions regarding the simpler details and processes (Score 2.0 content) and partial knowledge of the more complex ideas and processes (Score 3.0 content). |
| 2.0 |
The student demonstrates no major errors or omissions regarding the simpler details and processes but exhibits major errors or omissions regarding the more complex ideas and processes (Score 3.0 content). |
- |
| |
1.5 |
The student demonstrates partial knowledge of the simpler details and processes (Score 2.0 content) but exhibits major errors or omissions regarding the more complex ideas and procedures (Score 3.0 content). |
| 1.0 |
With help, the student demonstrates a partial understanding of some of the simpler details and processes (Score 2.0 content) and some of the more complex ideas and processes (Score 3.0 content). |
- |
| |
0.5 |
With help, the student demonstrates a partial understanding of some of the simpler details and processes (Score 2.0 content) but not the more complex ideas and processes (Score 3.0 content). |
| 0.0 |
Even with help, the student demonstrates no understanding or skill. |
- |
Resources
|
Web
|
|
Vocab
- skewed distribution
- symmetric distribution
- interquartile range
- standard deviation
|
|
|
MAT-HS.S-ID.03
|
MAT-HS Targeted Standards
(S) Concept: Statistics and Probability
(ID) Domain: Interpreting Categorical and Quantitative Data
Cluster: Summarize, represent, and interpret data on a single count or measurement variable
MAT-HS.S-ID.03 Interpret differences in shape, center, and spread in the context of the data sets, accounting for possible effects of extreme data points (outliers).
|
Student Learning Targets:
Knowledge Targets
- I can identify outliers (extreme data points) and their effects on data sets.
Reasoning Targets
Skills (Performance) Targets
- I can interpret differences in different data sets in context.
- I can interpret differences due to possible effects of outliers.
Product Targets
|
Proficiency Scale
| Score |
|
Description |
Sample Activity
|
| 4.0 |
In addition to Score 3.0, the student demonstrates in-depth inferences and applications regarding more complex material that go beyond end of instruction expectations. |
- |
| |
3.5 |
In addition to Score 3.0 performance, the student demonstrates in-depth inferences and applications regarding the more complex content with partial success. |
| 3.0 |
“The Standard.” The student demonstrates no major errors or omissions regarding any of the information and processes that were end of instruction expectations. |
- |
| |
2.5 |
The student demonstrates no major errors or omissions regarding the simpler details and processes (Score 2.0 content) and partial knowledge of the more complex ideas and processes (Score 3.0 content). |
| 2.0 |
The student demonstrates no major errors or omissions regarding the simpler details and processes but exhibits major errors or omissions regarding the more complex ideas and processes (Score 3.0 content). |
- |
| |
1.5 |
The student demonstrates partial knowledge of the simpler details and processes (Score 2.0 content) but exhibits major errors or omissions regarding the more complex ideas and procedures (Score 3.0 content). |
| 1.0 |
With help, the student demonstrates a partial understanding of some of the simpler details and processes (Score 2.0 content) and some of the more complex ideas and processes (Score 3.0 content). |
- |
| |
0.5 |
With help, the student demonstrates a partial understanding of some of the simpler details and processes (Score 2.0 content) but not the more complex ideas and processes (Score 3.0 content). |
| 0.0 |
Even with help, the student demonstrates no understanding or skill. |
- |
Resources
|
|
MAT-HS.S-ID.04
|
MAT-HS Targeted Standards
(S) Concept: Statistics and Probability
(ID) Domain: Interpreting Categorical and Quantitative Data
Cluster: Summarize, represent, and interpret data on a single count or measurement variable
MAT-HS.S-ID.04 Use the mean and standard deviation of a data set to fit it to a normal distribution and to estimate population percentages. Recognize that there are data sets for which such a procedure is not appropriate. Use calculators, spreadsheets, and tables to estimate areas under the normal curve.
|
Student Learning Targets:
Knowledge Targets
- I can identify whether data sets are approximately normal.
Reasoning Targets
Skills (Performance) Targets
- I can use the mean and standard deviation to fit the data set to a normal distribution where appropriate.
- I can use calculators, spreadsheets, and tables to estimate areas under the normal curve.
- I can interpret areas under a normal curve in context
Product Targets
|
Proficiency Scale
| Score |
|
Description |
Sample Activity
|
| 4.0 |
In addition to Score 3.0, the student demonstrates in-depth inferences and applications regarding more complex material that go beyond end of instruction expectations. |
- |
| |
3.5 |
In addition to Score 3.0 performance, the student demonstrates in-depth inferences and applications regarding the more complex content with partial success. |
| 3.0 |
“The Standard.” The student demonstrates no major errors or omissions regarding any of the information and processes that were end of instruction expectations. |
- |
| |
2.5 |
The student demonstrates no major errors or omissions regarding the simpler details and processes (Score 2.0 content) and partial knowledge of the more complex ideas and processes (Score 3.0 content). |
| 2.0 |
The student demonstrates no major errors or omissions regarding the simpler details and processes but exhibits major errors or omissions regarding the more complex ideas and processes (Score 3.0 content). |
- |
| |
1.5 |
The student demonstrates partial knowledge of the simpler details and processes (Score 2.0 content) but exhibits major errors or omissions regarding the more complex ideas and procedures (Score 3.0 content). |
| 1.0 |
With help, the student demonstrates a partial understanding of some of the simpler details and processes (Score 2.0 content) and some of the more complex ideas and processes (Score 3.0 content). |
- |
| |
0.5 |
With help, the student demonstrates a partial understanding of some of the simpler details and processes (Score 2.0 content) but not the more complex ideas and processes (Score 3.0 content). |
| 0.0 |
Even with help, the student demonstrates no understanding or skill. |
- |
Resources
|
|
MAT-HS.S-ID.05
|
MAT-HS Targeted Standards
(S) Concept: Statistics and Probability
(ID) Domain: Interpreting Categorical and Quantitative Data
Cluster: Summarize, represent, and interpret data on a single count or measurement variable
MAT-HS.S-ID.05 Summarize categorical data for two categories in two-way frequency tables. Interpret relative frequencies in the context of the data (including joint, marginal, and conditional relative frequencies). Recognize possible associations and trends in the data.
|
Student Learning Targets:
Knowledge Targets
Reasoning Targets
- I can analyze a set of data.
- I can recognize associations and trends in data from a two-way table.
Skills (Performance) Targets
- I can collect an appropriate set of data.
- I can interpret joint, marginal, and relative frequencies in context.
Product Targets
- I can construct a graph to represent a set of data.
- I can create a two-way table from two categorical variables and read values from two-way tables.
|
Proficiency Scale
| Score |
|
Description |
Sample Activity
|
| 4.0 |
In addition to Score 3.0, the student demonstrates in-depth inferences and applications regarding more complex material that go beyond end of instruction expectations. |
- |
| |
3.5 |
In addition to Score 3.0 performance, the student demonstrates in-depth inferences and applications regarding the more complex content with partial success. |
| 3.0 |
“The Standard.” The student demonstrates no major errors or omissions regarding any of the information and processes that were end of instruction expectations. |
- |
| |
2.5 |
The student demonstrates no major errors or omissions regarding the simpler details and processes (Score 2.0 content) and partial knowledge of the more complex ideas and processes (Score 3.0 content). |
| 2.0 |
The student demonstrates no major errors or omissions regarding the simpler details and processes but exhibits major errors or omissions regarding the more complex ideas and processes (Score 3.0 content). |
- |
| |
1.5 |
The student demonstrates partial knowledge of the simpler details and processes (Score 2.0 content) but exhibits major errors or omissions regarding the more complex ideas and procedures (Score 3.0 content). |
| 1.0 |
With help, the student demonstrates a partial understanding of some of the simpler details and processes (Score 2.0 content) and some of the more complex ideas and processes (Score 3.0 content). |
- |
| |
0.5 |
With help, the student demonstrates a partial understanding of some of the simpler details and processes (Score 2.0 content) but not the more complex ideas and processes (Score 3.0 content). |
| 0.0 |
Even with help, the student demonstrates no understanding or skill. |
- |
Resources
| Web |
|
Vocab
- two-way frequency table
- joint frequency
- marginal frequency
- relative frequency
|
|
|
MAT-HS.S-ID.06
|
MAT-HS Targeted Standards
(S) Concept: Statistics and Probability
(ID) Domain: Interpreting Categorical and Quantitative Data
Cluster: Summarize, represent, and interpret data on two categorical and quantitative variables
MAT-HS.S-ID.06 Represent data on two quantitative variables on a scatter plot, and describe how the variables are related.
- a. Fit a function to the data; use functions fitted to data to solve problems in the context of the data. Use given functions or choose a function suggested by the context. Emphasize linear and exponential models.
- b. Informally assess the fit of a function by plotting and analyzing residuals.
- c. Fit a linear function for a scatter plot that suggests a linear association.
|
Student Learning Targets:
Knowledge Targets
Reasoning Targets
- I can categorize data as linear, exponential, quadratic or neither.
- I can categorize data as linear or non-linear.
Skills (Performance) Targets
- I can describe the form, strength and direction of the relationship.
- I can use algebraic methods or technology to fit the data to a linear, exponential or quadratic function and use the function to predict values.
- I can explain the meaning of slope and y-intercept (linear model) or the meaning of the growth rate and y-intercept (exponential model) or the meaning of the coefficients (quadratic model) in context.
- I can calculate a residual.
- I can use algebraic methods or technology to fit the data to a linear function.
- I can use the function to predict values.
Product Targets
- I can create a scatter plot from two quantitative variables.
- I can create and analyze a residual plot.
|
Proficiency Scale
| Score |
|
Description |
Sample Activity
|
| 4.0 |
In addition to Score 3.0, the student demonstrates in-depth inferences and applications regarding more complex material that go beyond end of instruction expectations. |
- |
| |
3.5 |
In addition to Score 3.0 performance, the student demonstrates in-depth inferences and applications regarding the more complex content with partial success. |
| 3.0 |
“The Standard.” The student demonstrates no major errors or omissions regarding any of the information and processes that were end of instruction expectations. |
- |
| |
2.5 |
The student demonstrates no major errors or omissions regarding the simpler details and processes (Score 2.0 content) and partial knowledge of the more complex ideas and processes (Score 3.0 content). |
| 2.0 |
The student demonstrates no major errors or omissions regarding the simpler details and processes but exhibits major errors or omissions regarding the more complex ideas and processes (Score 3.0 content). |
- |
| |
1.5 |
The student demonstrates partial knowledge of the simpler details and processes (Score 2.0 content) but exhibits major errors or omissions regarding the more complex ideas and procedures (Score 3.0 content). |
| 1.0 |
With help, the student demonstrates a partial understanding of some of the simpler details and processes (Score 2.0 content) and some of the more complex ideas and processes (Score 3.0 content). |
- |
| |
0.5 |
With help, the student demonstrates a partial understanding of some of the simpler details and processes (Score 2.0 content) but not the more complex ideas and processes (Score 3.0 content). |
| 0.0 |
Even with help, the student demonstrates no understanding or skill. |
- |
Resources
|
Web
|
|
Vocab
- scatter plot
- residual
- residual plot
|
|
|
MAT-HS.S-ID.07
|
MAT-HS Targeted Standards
(S) Concept: Statistics and Probability
(ID) Domain: Interpreting Categorical and Quantitative Data
Cluster: Interpret linear models
MAT-HS.S-ID.07 Interpret the slope (rate of change) and the intercept (constant term) of a linear model in the context of the data.
|
Student Learning Targets:
Knowledge Targets
- I can identify Cartesian coordinate system.
- I can define slope.
- I can recall slope intercept, point-slope, and standard form.
- I know the midpoint and slope formula.
Reasoning Targets
- I can explain the meaning of the slope and y-intercept in context.
Skills (Performance) Targets
- I can find slope give Cartesian coordinates, graph, or equation.
Product Targets
|
Proficiency Scale
| Score |
|
Description |
Sample Activity
|
| 4.0 |
In addition to Score 3.0, the student demonstrates in-depth inferences and applications regarding more complex material that go beyond end of instruction expectations. |
- |
| |
3.5 |
In addition to Score 3.0 performance, the student demonstrates in-depth inferences and applications regarding the more complex content with partial success. |
| 3.0 |
The student:
- can explain the meaning of the slope of a linear model in context
- can explain the y-intercept of a linear model in context
- can use a trend line and line of best fit to make predictions
The student exhibits no major errors or omissions.
|
Use the following table to estimate the heart rate prior to jogging and after jogging for 16 minutes. Explain why your answer makes sense. 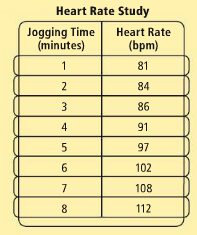 |
| |
2.5 |
The student demonstrates no major errors or omissions regarding the simpler details and processes (Score 2.0 content) and partial knowledge of the more complex ideas and processes (Score 3.0 content). |
| 2.0 |
There are no major errors or omissions regarding the simpler details and processes as the student:
The student can:
- can recognize and recall terminology such as:
- equation, slope, y-intercept
- can graph a linear model, but can not interpret the results
However, the student exhibits major errors or omissions regarding the more complex ideas and processes.
|
- |
| |
1.5 |
The student demonstrates partial knowledge of the simpler details and processes (Score 2.0 content) but exhibits major errors or omissions regarding the more complex ideas and procedures (Score 3.0 content). |
| 1.0 |
With help, the student demonstrates a partial understanding of some of the simpler details and processes (Score 2.0 content) and some of the more complex ideas and processes (Score 3.0 content). |
- |
| |
0.5 |
With help, the student demonstrates a partial understanding of some of the simpler details and processes (Score 2.0 content) but not the more complex ideas and processes (Score 3.0 content). |
| 0.0 |
Even with help, the student demonstrates no understanding or skill. |
- |
Resources
|
|
MAT-HS.S-ID.08
|
MAT-HS Targeted Standards
(S) Concept: Statistics and Probability
(ID) Domain: Interpreting Categorical and Quantitative Data
Cluster: Interpret linear models
MAT-HS.S-ID.08 Compute (using technology) and interpret the correlation coefficient of a linear fit.
|
Student Learning Targets:
Knowledge Targets
Reasoning Targets
Skills (Performance) Targets
- I can use a calculator or computer to find the correlation coefficient for a linear association.
- I can interpret the meaning of the correlation coefficient in the context of the data.
Product Targets
|
Proficiency Scale
| Score |
|
Description |
Sample Activity
|
| 4.0 |
In addition to Score 3.0, the student demonstrates in-depth inferences and applications regarding more complex material that go beyond end of instruction expectations. |
- |
| |
3.5 |
In addition to Score 3.0 performance, the student demonstrates in-depth inferences and applications regarding the more complex content with partial success. |
| 3.0 |
“The Standard.” The student demonstrates no major errors or omissions regarding any of the information and processes that were end of instruction expectations. |
- |
| |
2.5 |
The student demonstrates no major errors or omissions regarding the simpler details and processes (Score 2.0 content) and partial knowledge of the more complex ideas and processes (Score 3.0 content). |
| 2.0 |
The student demonstrates no major errors or omissions regarding the simpler details and processes but exhibits major errors or omissions regarding the more complex ideas and processes (Score 3.0 content). |
- |
| |
1.5 |
The student demonstrates partial knowledge of the simpler details and processes (Score 2.0 content) but exhibits major errors or omissions regarding the more complex ideas and procedures (Score 3.0 content). |
| 1.0 |
With help, the student demonstrates a partial understanding of some of the simpler details and processes (Score 2.0 content) and some of the more complex ideas and processes (Score 3.0 content). |
- |
| |
0.5 |
With help, the student demonstrates a partial understanding of some of the simpler details and processes (Score 2.0 content) but not the more complex ideas and processes (Score 3.0 content). |
| 0.0 |
Even with help, the student demonstrates no understanding or skill. |
- |
Resources
|
|
MAT-HS.S-ID.09
|
MAT-HS Targeted Standards
(S) Concept: Statistics and Probability
(ID) Domain: Interpreting Categorical and Quantitative Data
Cluster: Interpret linear models
MAT-HS.S-ID.09 Distinguish between correlation and causation.
|
Student Learning Targets:
Knowledge Targets
Reasoning Targets
- I can explain the difference between correlation and causation.
Skills (Performance) Targets
Product Targets
|
Proficiency Scale
| Score |
|
Description |
Sample Activity
|
| 4.0 |
In addition to Score 3.0, the student demonstrates in-depth inferences and applications regarding more complex material that go beyond end of instruction expectations. |
- |
| |
3.5 |
In addition to Score 3.0 performance, the student demonstrates in-depth inferences and applications regarding the more complex content with partial success. |
| 3.0 |
“The Standard.” The student demonstrates no major errors or omissions regarding any of the information and processes that were end of instruction expectations. |
- |
| |
2.5 |
The student demonstrates no major errors or omissions regarding the simpler details and processes (Score 2.0 content) and partial knowledge of the more complex ideas and processes (Score 3.0 content). |
| 2.0 |
The student demonstrates no major errors or omissions regarding the simpler details and processes but exhibits major errors or omissions regarding the more complex ideas and processes (Score 3.0 content). |
- |
| |
1.5 |
The student demonstrates partial knowledge of the simpler details and processes (Score 2.0 content) but exhibits major errors or omissions regarding the more complex ideas and procedures (Score 3.0 content). |
| 1.0 |
With help, the student demonstrates a partial understanding of some of the simpler details and processes (Score 2.0 content) and some of the more complex ideas and processes (Score 3.0 content). |
- |
| |
0.5 |
With help, the student demonstrates a partial understanding of some of the simpler details and processes (Score 2.0 content) but not the more complex ideas and processes (Score 3.0 content). |
| 0.0 |
Even with help, the student demonstrates no understanding or skill. |
- |
Resources
|
|