MAT-HS.S-ID.06
|
MAT-HS Targeted Standards
(S) Concept: Statistics and Probability
(ID) Domain: Interpreting Categorical and Quantitative Data
Cluster: Summarize, represent, and interpret data on two categorical and quantitative variables
MAT-HS.S-ID.06 Represent data on two quantitative variables on a scatter plot, and describe how the variables are related.
- a. Fit a function to the data; use functions fitted to data to solve problems in the context of the data. Use given functions or choose a function suggested by the context. Emphasize linear and exponential models.
- b. Informally assess the fit of a function by plotting and analyzing residuals.
- c. Fit a linear function for a scatter plot that suggests a linear association.
|
Student Learning Targets:
Knowledge Targets
Reasoning Targets
- I can categorize data as linear, exponential, quadratic or neither.
- I can categorize data as linear or non-linear.
Skills (Performance) Targets
- I can describe the form, strength and direction of the relationship.
- I can use algebraic methods or technology to fit the data to a linear, exponential or quadratic function and use the function to predict values.
- I can explain the meaning of slope and y-intercept (linear model) or the meaning of the growth rate and y-intercept (exponential model) or the meaning of the coefficients (quadratic model) in context.
- I can calculate a residual.
- I can use algebraic methods or technology to fit the data to a linear function.
- I can use the function to predict values.
Product Targets
- I can create a scatter plot from two quantitative variables.
- I can create and analyze a residual plot.
|
Proficiency Scale
| Score |
|
Description |
Sample Activity
|
| 4.0 |
In addition to Score 3.0, the student demonstrates in-depth inferences and applications regarding more complex material that go beyond end of instruction expectations. |
- |
| |
3.5 |
In addition to Score 3.0 performance, the student demonstrates in-depth inferences and applications regarding the more complex content with partial success. |
| 3.0 |
“The Standard.” The student demonstrates no major errors or omissions regarding any of the information and processes that were end of instruction expectations. |
- |
| |
2.5 |
The student demonstrates no major errors or omissions regarding the simpler details and processes (Score 2.0 content) and partial knowledge of the more complex ideas and processes (Score 3.0 content). |
| 2.0 |
The student demonstrates no major errors or omissions regarding the simpler details and processes but exhibits major errors or omissions regarding the more complex ideas and processes (Score 3.0 content). |
- |
| |
1.5 |
The student demonstrates partial knowledge of the simpler details and processes (Score 2.0 content) but exhibits major errors or omissions regarding the more complex ideas and procedures (Score 3.0 content). |
| 1.0 |
With help, the student demonstrates a partial understanding of some of the simpler details and processes (Score 2.0 content) and some of the more complex ideas and processes (Score 3.0 content). |
- |
| |
0.5 |
With help, the student demonstrates a partial understanding of some of the simpler details and processes (Score 2.0 content) but not the more complex ideas and processes (Score 3.0 content). |
| 0.0 |
Even with help, the student demonstrates no understanding or skill. |
- |
Resources
|
Web
|
|
Vocab
- scatter plot
- residual
- residual plot
|
|
|
MAT-HS.S-ID.07
|
MAT-HS Targeted Standards
(S) Concept: Statistics and Probability
(ID) Domain: Interpreting Categorical and Quantitative Data
Cluster: Interpret linear models
MAT-HS.S-ID.07 Interpret the slope (rate of change) and the intercept (constant term) of a linear model in the context of the data.
|
Student Learning Targets:
Knowledge Targets
- I can identify Cartesian coordinate system.
- I can define slope.
- I can recall slope intercept, point-slope, and standard form.
- I know the midpoint and slope formula.
Reasoning Targets
- I can explain the meaning of the slope and y-intercept in context.
Skills (Performance) Targets
- I can find slope give Cartesian coordinates, graph, or equation.
Product Targets
|
Proficiency Scale
| Score |
|
Description |
Sample Activity
|
| 4.0 |
In addition to Score 3.0, the student demonstrates in-depth inferences and applications regarding more complex material that go beyond end of instruction expectations. |
- |
| |
3.5 |
In addition to Score 3.0 performance, the student demonstrates in-depth inferences and applications regarding the more complex content with partial success. |
| 3.0 |
The student:
- can explain the meaning of the slope of a linear model in context
- can explain the y-intercept of a linear model in context
- can use a trend line and line of best fit to make predictions
The student exhibits no major errors or omissions.
|
Use the following table to estimate the heart rate prior to jogging and after jogging for 16 minutes. Explain why your answer makes sense. 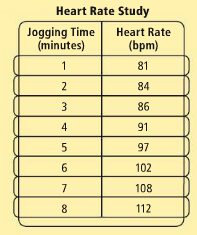 |
| |
2.5 |
The student demonstrates no major errors or omissions regarding the simpler details and processes (Score 2.0 content) and partial knowledge of the more complex ideas and processes (Score 3.0 content). |
| 2.0 |
There are no major errors or omissions regarding the simpler details and processes as the student:
The student can:
- can recognize and recall terminology such as:
- equation, slope, y-intercept
- can graph a linear model, but can not interpret the results
However, the student exhibits major errors or omissions regarding the more complex ideas and processes.
|
- |
| |
1.5 |
The student demonstrates partial knowledge of the simpler details and processes (Score 2.0 content) but exhibits major errors or omissions regarding the more complex ideas and procedures (Score 3.0 content). |
| 1.0 |
With help, the student demonstrates a partial understanding of some of the simpler details and processes (Score 2.0 content) and some of the more complex ideas and processes (Score 3.0 content). |
- |
| |
0.5 |
With help, the student demonstrates a partial understanding of some of the simpler details and processes (Score 2.0 content) but not the more complex ideas and processes (Score 3.0 content). |
| 0.0 |
Even with help, the student demonstrates no understanding or skill. |
- |
Resources
|
|
MAT-HS.S-ID.08
|
MAT-HS Targeted Standards
(S) Concept: Statistics and Probability
(ID) Domain: Interpreting Categorical and Quantitative Data
Cluster: Interpret linear models
MAT-HS.S-ID.08 Compute (using technology) and interpret the correlation coefficient of a linear fit.
|
Student Learning Targets:
Knowledge Targets
Reasoning Targets
Skills (Performance) Targets
- I can use a calculator or computer to find the correlation coefficient for a linear association.
- I can interpret the meaning of the correlation coefficient in the context of the data.
Product Targets
|
Proficiency Scale
| Score |
|
Description |
Sample Activity
|
| 4.0 |
In addition to Score 3.0, the student demonstrates in-depth inferences and applications regarding more complex material that go beyond end of instruction expectations. |
- |
| |
3.5 |
In addition to Score 3.0 performance, the student demonstrates in-depth inferences and applications regarding the more complex content with partial success. |
| 3.0 |
“The Standard.” The student demonstrates no major errors or omissions regarding any of the information and processes that were end of instruction expectations. |
- |
| |
2.5 |
The student demonstrates no major errors or omissions regarding the simpler details and processes (Score 2.0 content) and partial knowledge of the more complex ideas and processes (Score 3.0 content). |
| 2.0 |
The student demonstrates no major errors or omissions regarding the simpler details and processes but exhibits major errors or omissions regarding the more complex ideas and processes (Score 3.0 content). |
- |
| |
1.5 |
The student demonstrates partial knowledge of the simpler details and processes (Score 2.0 content) but exhibits major errors or omissions regarding the more complex ideas and procedures (Score 3.0 content). |
| 1.0 |
With help, the student demonstrates a partial understanding of some of the simpler details and processes (Score 2.0 content) and some of the more complex ideas and processes (Score 3.0 content). |
- |
| |
0.5 |
With help, the student demonstrates a partial understanding of some of the simpler details and processes (Score 2.0 content) but not the more complex ideas and processes (Score 3.0 content). |
| 0.0 |
Even with help, the student demonstrates no understanding or skill. |
- |
Resources
|
|
MAT-HS.S-ID.09
|
MAT-HS Targeted Standards
(S) Concept: Statistics and Probability
(ID) Domain: Interpreting Categorical and Quantitative Data
Cluster: Interpret linear models
MAT-HS.S-ID.09 Distinguish between correlation and causation.
|
Student Learning Targets:
Knowledge Targets
Reasoning Targets
- I can explain the difference between correlation and causation.
Skills (Performance) Targets
Product Targets
|
Proficiency Scale
| Score |
|
Description |
Sample Activity
|
| 4.0 |
In addition to Score 3.0, the student demonstrates in-depth inferences and applications regarding more complex material that go beyond end of instruction expectations. |
- |
| |
3.5 |
In addition to Score 3.0 performance, the student demonstrates in-depth inferences and applications regarding the more complex content with partial success. |
| 3.0 |
“The Standard.” The student demonstrates no major errors or omissions regarding any of the information and processes that were end of instruction expectations. |
- |
| |
2.5 |
The student demonstrates no major errors or omissions regarding the simpler details and processes (Score 2.0 content) and partial knowledge of the more complex ideas and processes (Score 3.0 content). |
| 2.0 |
The student demonstrates no major errors or omissions regarding the simpler details and processes but exhibits major errors or omissions regarding the more complex ideas and processes (Score 3.0 content). |
- |
| |
1.5 |
The student demonstrates partial knowledge of the simpler details and processes (Score 2.0 content) but exhibits major errors or omissions regarding the more complex ideas and procedures (Score 3.0 content). |
| 1.0 |
With help, the student demonstrates a partial understanding of some of the simpler details and processes (Score 2.0 content) and some of the more complex ideas and processes (Score 3.0 content). |
- |
| |
0.5 |
With help, the student demonstrates a partial understanding of some of the simpler details and processes (Score 2.0 content) but not the more complex ideas and processes (Score 3.0 content). |
| 0.0 |
Even with help, the student demonstrates no understanding or skill. |
- |
Resources
|
|
MAT-HS.S-MD.01
|
MAT-HS Targeted Standards
(S) Concept: Statistics and Probability
(MD) Domain: Using Probability to Make Decisions
Cluster: Calculate expected values and use them to solve problems.
MAT-HS.S-MD.01 Define a random variable for a quantity of interest by assigning a numerical value to each event in a sample space; graph the corresponding probability distribution using the same graphical displays as for data distributions.
|
Student Learning Targets:
Knowledge Targets
Reasoning Targets
Skills (Performance) Targets
Product Targets
|
Proficiency Scale
| Score |
|
Description |
Sample Activity
|
| 4.0 |
In addition to Score 3.0, the student demonstrates in-depth inferences and applications regarding more complex material that go beyond end of instruction expectations. |
- |
| |
3.5 |
In addition to Score 3.0 performance, the student demonstrates in-depth inferences and applications regarding the more complex content with partial success. |
| 3.0 |
“The Standard.” The student demonstrates no major errors or omissions regarding any of the information and processes that were end of instruction expectations. |
- |
| |
2.5 |
The student demonstrates no major errors or omissions regarding the simpler details and processes (Score 2.0 content) and partial knowledge of the more complex ideas and processes (Score 3.0 content). |
| 2.0 |
The student demonstrates no major errors or omissions regarding the simpler details and processes but exhibits major errors or omissions regarding the more complex ideas and processes (Score 3.0 content). |
- |
| |
1.5 |
The student demonstrates partial knowledge of the simpler details and processes (Score 2.0 content) but exhibits major errors or omissions regarding the more complex ideas and procedures (Score 3.0 content). |
| 1.0 |
With help, the student demonstrates a partial understanding of some of the simpler details and processes (Score 2.0 content) and some of the more complex ideas and processes (Score 3.0 content). |
- |
| |
0.5 |
With help, the student demonstrates a partial understanding of some of the simpler details and processes (Score 2.0 content) but not the more complex ideas and processes (Score 3.0 content). |
| 0.0 |
Even with help, the student demonstrates no understanding or skill. |
- |
Resources
|
|
MAT-HS.S-MD.02
|
MAT-HS Targeted Standards
(S) Concept: Statistics and Probability
(MD) Domain: Using Probability to Make Decisions
Cluster: Calculate expected values and use them to solve problems.
MAT-HS.S-MD.02 Calculate the expected value of a random variable; interpret it as the mean of the probability distribution.
|
Student Learning Targets:
Knowledge Targets
Reasoning Targets
Skills (Performance) Targets
Product Targets
|
Proficiency Scale
| Score |
|
Description |
Sample Activity
|
| 4.0 |
In addition to Score 3.0, the student demonstrates in-depth inferences and applications regarding more complex material that go beyond end of instruction expectations. |
- |
| |
3.5 |
In addition to Score 3.0 performance, the student demonstrates in-depth inferences and applications regarding the more complex content with partial success. |
| 3.0 |
“The Standard.” The student demonstrates no major errors or omissions regarding any of the information and processes that were end of instruction expectations. |
- |
| |
2.5 |
The student demonstrates no major errors or omissions regarding the simpler details and processes (Score 2.0 content) and partial knowledge of the more complex ideas and processes (Score 3.0 content). |
| 2.0 |
The student demonstrates no major errors or omissions regarding the simpler details and processes but exhibits major errors or omissions regarding the more complex ideas and processes (Score 3.0 content). |
- |
| |
1.5 |
The student demonstrates partial knowledge of the simpler details and processes (Score 2.0 content) but exhibits major errors or omissions regarding the more complex ideas and procedures (Score 3.0 content). |
| 1.0 |
With help, the student demonstrates a partial understanding of some of the simpler details and processes (Score 2.0 content) and some of the more complex ideas and processes (Score 3.0 content). |
- |
| |
0.5 |
With help, the student demonstrates a partial understanding of some of the simpler details and processes (Score 2.0 content) but not the more complex ideas and processes (Score 3.0 content). |
| 0.0 |
Even with help, the student demonstrates no understanding or skill. |
- |
Resources
|
|
MAT-HS.S-MD.03
|
MAT-HS Targeted Standards
(S) Concept: Statistics and Probability
(MD) Domain: Using Probability to Make Decisions
Cluster: Calculate expected values and use them to solve problems.
MAT-HS.S-MD.03 Develop a probability distribution for a random variable defined for a sample space in which theoretical probabilities can be calculated; find the expected value.
For example, find the theoretical probability distribution for the number of correct answers obtained by guessing on all five questions of a multiple-choice test where each question has four choices, and find the expected grade under various grading schemes. |
Student Learning Targets:
Knowledge Targets
Reasoning Targets
Skills (Performance) Targets
Product Targets
|
Proficiency Scale
| Score |
|
Description |
Sample Activity
|
| 4.0 |
In addition to Score 3.0, the student demonstrates in-depth inferences and applications regarding more complex material that go beyond end of instruction expectations. |
- |
| |
3.5 |
In addition to Score 3.0 performance, the student demonstrates in-depth inferences and applications regarding the more complex content with partial success. |
| 3.0 |
“The Standard.” The student demonstrates no major errors or omissions regarding any of the information and processes that were end of instruction expectations. |
- |
| |
2.5 |
The student demonstrates no major errors or omissions regarding the simpler details and processes (Score 2.0 content) and partial knowledge of the more complex ideas and processes (Score 3.0 content). |
| 2.0 |
The student demonstrates no major errors or omissions regarding the simpler details and processes but exhibits major errors or omissions regarding the more complex ideas and processes (Score 3.0 content). |
- |
| |
1.5 |
The student demonstrates partial knowledge of the simpler details and processes (Score 2.0 content) but exhibits major errors or omissions regarding the more complex ideas and procedures (Score 3.0 content). |
| 1.0 |
With help, the student demonstrates a partial understanding of some of the simpler details and processes (Score 2.0 content) and some of the more complex ideas and processes (Score 3.0 content). |
- |
| |
0.5 |
With help, the student demonstrates a partial understanding of some of the simpler details and processes (Score 2.0 content) but not the more complex ideas and processes (Score 3.0 content). |
| 0.0 |
Even with help, the student demonstrates no understanding or skill. |
- |
Resources
|
|
MAT-HS.S-MD.04
|
MAT-HS Targeted Standards
(S) Concept: Statistics and Probability
(MD) Domain: Using Probability to Make Decisions
Cluster: Calculate expected values and use them to solve problems.
MAT-HS.S-MD.04 Develop a probability distribution for a random variable defined for a sample space in which probabilities are assigned empirically; find the expected value.
For example, find a current data distribution on the number of TV sets per household in the United States, and calculate the expect ed number of sets per household. How many TV sets would you expect to find in 100 randomly selected households? |
Student Learning Targets:
Knowledge Targets
Reasoning Targets
Skills (Performance) Targets
Product Targets
|
Proficiency Scale
| Score |
|
Description |
Sample Activity
|
| 4.0 |
In addition to Score 3.0, the student demonstrates in-depth inferences and applications regarding more complex material that go beyond end of instruction expectations. |
- |
| |
3.5 |
In addition to Score 3.0 performance, the student demonstrates in-depth inferences and applications regarding the more complex content with partial success. |
| 3.0 |
“The Standard.” The student demonstrates no major errors or omissions regarding any of the information and processes that were end of instruction expectations. |
- |
| |
2.5 |
The student demonstrates no major errors or omissions regarding the simpler details and processes (Score 2.0 content) and partial knowledge of the more complex ideas and processes (Score 3.0 content). |
| 2.0 |
The student demonstrates no major errors or omissions regarding the simpler details and processes but exhibits major errors or omissions regarding the more complex ideas and processes (Score 3.0 content). |
- |
| |
1.5 |
The student demonstrates partial knowledge of the simpler details and processes (Score 2.0 content) but exhibits major errors or omissions regarding the more complex ideas and procedures (Score 3.0 content). |
| 1.0 |
With help, the student demonstrates a partial understanding of some of the simpler details and processes (Score 2.0 content) and some of the more complex ideas and processes (Score 3.0 content). |
- |
| |
0.5 |
With help, the student demonstrates a partial understanding of some of the simpler details and processes (Score 2.0 content) but not the more complex ideas and processes (Score 3.0 content). |
| 0.0 |
Even with help, the student demonstrates no understanding or skill. |
- |
Resources
|
|
MAT-HS.S-MD.05
|
MAT-HS Targeted Standards
(S) Concept: Statistics and Probability
(MD) Domain: Using Probability to Make Decisions
Cluster: Use probability to evaluate outcomes of decisions.
MAT-HS.S-MD.05 Use probability to evaluate outcomes of decisions
- a. Find the expected payoff for a game of chance.
For example, find the expected winnings from a state lottery ticket or a game at a fast-food restaurant.
- b. Evaluate and compare strategies on the basis of expected values.
For example, compare a high-deductible versus a low-deductible automobile insurance policy using various, but reasonable, chances of having a minor or a major accident.
|
Student Learning Targets:
Knowledge Targets
Reasoning Targets
Skills (Performance) Targets
Product Targets
|
Proficiency Scale
| Score |
|
Description |
Sample Activity
|
| 4.0 |
In addition to Score 3.0, the student demonstrates in-depth inferences and applications regarding more complex material that go beyond end of instruction expectations. |
- |
| |
3.5 |
In addition to Score 3.0 performance, the student demonstrates in-depth inferences and applications regarding the more complex content with partial success. |
| 3.0 |
“The Standard.” The student demonstrates no major errors or omissions regarding any of the information and processes that were end of instruction expectations. |
- |
| |
2.5 |
The student demonstrates no major errors or omissions regarding the simpler details and processes (Score 2.0 content) and partial knowledge of the more complex ideas and processes (Score 3.0 content). |
| 2.0 |
The student demonstrates no major errors or omissions regarding the simpler details and processes but exhibits major errors or omissions regarding the more complex ideas and processes (Score 3.0 content). |
- |
| |
1.5 |
The student demonstrates partial knowledge of the simpler details and processes (Score 2.0 content) but exhibits major errors or omissions regarding the more complex ideas and procedures (Score 3.0 content). |
| 1.0 |
With help, the student demonstrates a partial understanding of some of the simpler details and processes (Score 2.0 content) and some of the more complex ideas and processes (Score 3.0 content). |
- |
| |
0.5 |
With help, the student demonstrates a partial understanding of some of the simpler details and processes (Score 2.0 content) but not the more complex ideas and processes (Score 3.0 content). |
| 0.0 |
Even with help, the student demonstrates no understanding or skill. |
- |
Resources
|
|
MAT-HS.S-MD.06
|
MAT-HS Targeted Standards
(S) Concept: Statistics and Probability
(MD) Domain: Using Probability to Make Decisions
Cluster: Use probability to evaluate outcomes of decisions
MAT-HS.S-MD.06 Use probabilities to make fair decisions (e.g., drawing by lots, using a random number generator).
|
Student Learning Targets:
Knowledge Targets
Reasoning Targets
- I can use expected values to compare long term benefits of several situations.
Skills (Performance) Targets
- I can use expected values to help make good decisions.
Product Targets
|
Proficiency Scale
| Score |
|
Description |
Sample Activity
|
| 4.0 |
In addition to Score 3.0, the student demonstrates in-depth inferences and applications regarding more complex material that go beyond end of instruction expectations. |
- |
| |
3.5 |
In addition to Score 3.0 performance, the student demonstrates in-depth inferences and applications regarding the more complex content with partial success. |
| 3.0 |
“The Standard.” The student demonstrates no major errors or omissions regarding any of the information and processes that were end of instruction expectations. |
- |
| |
2.5 |
The student demonstrates no major errors or omissions regarding the simpler details and processes (Score 2.0 content) and partial knowledge of the more complex ideas and processes (Score 3.0 content). |
| 2.0 |
The student demonstrates no major errors or omissions regarding the simpler details and processes but exhibits major errors or omissions regarding the more complex ideas and processes (Score 3.0 content). |
- |
| |
1.5 |
The student demonstrates partial knowledge of the simpler details and processes (Score 2.0 content) but exhibits major errors or omissions regarding the more complex ideas and procedures (Score 3.0 content). |
| 1.0 |
With help, the student demonstrates a partial understanding of some of the simpler details and processes (Score 2.0 content) and some of the more complex ideas and processes (Score 3.0 content). |
- |
| |
0.5 |
With help, the student demonstrates a partial understanding of some of the simpler details and processes (Score 2.0 content) but not the more complex ideas and processes (Score 3.0 content). |
| 0.0 |
Even with help, the student demonstrates no understanding or skill. |
- |
Resources
|
|