MAT-HS Targeted Standards (F) Concept: Function (IF) Domain: Interpreting Functions Cluster: Interpret functions that arise in applications in terms of the context
MAT-HS.F-IF.04* For a function that models a relationship between two quantities, interpret key features of graphs and tables in terms of the quantities, and sketch graphs showing key features given a verbal description of the relationship.
Key features include: intercepts; intervals where the function is increasing, decreasing, positive, or negative; relative maximums and minimums; symmetries; end behavior; and periodicity.
Student Learning Targets:
Knowledge Targets
I can identify key features in graphs and tables to include intercepts; intervals where the function is increasing, decreasing, positive, or negative; relative maximums and minimums; symmetries; end behavior; and periodicity for a given function.
Reasoning Targets
I can
I can
Skills (Performance) Targets
I can use correct notation when identifying key features of graphs and tables.
Product Targets
I can sketch the graph of a function given its key features.
Alg II Key Features of Graphs Proficiency Scale
Score
Description
Sample Activity
4.0
(advanced)
In addition to Score 3.0, the student demonstrates in-depth inferences and applications regarding more complex material that go beyond end of instruction expectations.
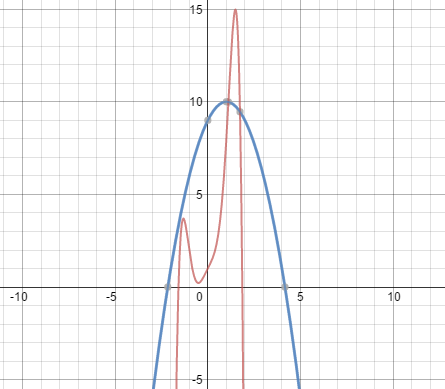
Given the graph, identify the intervals where both functions are increasing.
3.5
In addition to Score 3.0 performance, the student demonstrates in-depth inferences and applications regarding the more complex content with partial success.
3.0
(proficient)
The student can:
identify key features in graphs and tables including intercepts; intervals where the function is increasing, decreasing, positive, or negative; relative maximums and minimums; symmetries; end behavior; domain and range; and periodicity for a given function.
sketch the graph of a function given its key features.
The student exhibits no major errors or omissions.
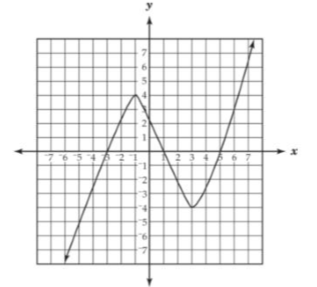
Identify the following from the graph:
x-intercepts:
y-intercepts:
Increasing Intervals:
Decreasing Intervals:
Positive Intervals:
Negative Intervals:
Maximums:
Minimums:
Domain:
Range:
Sketch a function that would have an increasing interval from (3,+∞) and a relative minimum at (3,4).
2.5
The student demonstrates no major errors or omissions regarding the simpler details and processes (Score 2.0 content) and partial knowledge of the more complex ideas and processes (Score 3.0 content).
2.0
(progressing)
There are no major errors or omissions regarding the simpler details and processes as the student can:
Recognize and recall specific terminology such as:
intervals
intercept (x and y)
relative minimum and maximum
periodicity
end behavior
symmetry
increasing
decreasing
use interval notation accurately.
However, the student exhibits major errors or omissions regarding the more complex ideas and processes.
Write the following in interval notation:
x<3
x>5
x≥10
5<x≤9
For the graph given, the function is increasing from________ to -1 and 3 to _______.
1.5
The student demonstrates partial knowledge of the simpler details and processes (Score 2.0 content) but exhibits major errors or omissions regarding the more complex ideas and procedures (Score 3.0 content).
1.0
(beginning)
With help, the student demonstrates a partial understanding of some of the simpler details and processes (Score 2.0 content) and some of the more complex ideas and processes (Score 3.0 content).
0.5
With help, the student demonstrates a partial understanding of some of the simpler details and processes (Score 2.0 content) but not the more complex ideas and processes (Score 3.0 content).
0.0
Even with help, the student demonstrates no understanding or skill.