MAT-HS.F-IF.07.b
|
MAT-HS Targeted Standards
(F) Concept: Function
(IF) Domain: Interpreting Functions
Cluster: Analyze functions using different representations
MAT-HS.F-IF.07* Graph functions expressed symbolically and show key features of the graph, by hand in simple cases and using technology for more complicated cases.
- a. Graph linear and quadratic functions and show intercepts, maxima, and minima.
- b. Graph square root, cube root, and piecewise-defined functions, including step functions and absolute value functions.
- c. Graph polynomial functions, identifying zeros when suitable factorizations are available, and showing end behavior.
- d. (+) Graph rational functions, identifying zeros and asymptotes when suitable factorizations are available, and showing end behavior.
- e. Graph exponential and logarithmic functions, showing intercepts and end behavior, and trigonometric functions, showing period, midline, and amplitude.
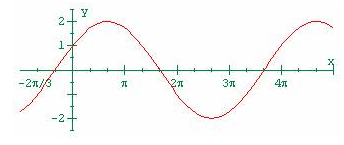
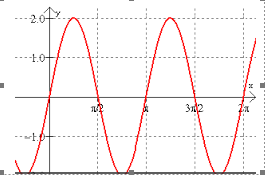
- f. Graph f(x)=sin x and f(x)=cos x as representations of periodic phenomena.
- g. (+) Graph trigonometric functions, showing period, midline, phase shift and amplitude
|
Student Learning Targets:
Knowledge Targets
Reasoning Targets
Skills (Performance) Targets
Product Targets
|
Alg II Graph Square Root Functions Proficiency Scale
| Score |
|
Description |
Sample Activity
|
|
4.0
(advanced) |
In addition to Score 3.0, the student demonstrates in-depth inferences and applications regarding more complex material that go beyond end of instruction expectations. |
Graph the following function: 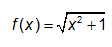
|
| |
3.5 |
In addition to Score 3.0 performance, the student demonstrates in-depth inferences and applications regarding the more complex content with partial success. |
|
3.0
(proficient)
|
The student can:
- graph square root functions symbolically and show key features of the graph (graph simple cases by hand and use technology to show more complicated cases).
The student exhibits no major errors or omissions. |
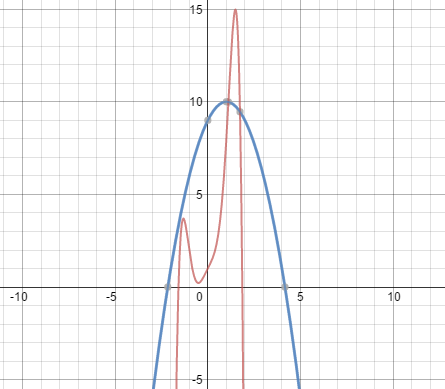
Graph the following equations and identify all the key features including:x-intercepts, y-intercepts, increasing interval, decreasing interval, maximums, minimums, domain and range. 
|
| |
2.5 |
The student demonstrates no major errors or omissions regarding the simpler details and processes (Score 2.0 content) and partial knowledge of the more complex ideas and processes (Score 3.0 content). |
|
2.0
(progressing)
|
There are no major errors or omissions regarding the simpler details and processes as the student can:
- recognize and recall basic terminology, such as:
-
radical
-
index
-
radicand
-
perfect squares
-
x-intercepts
-
y-intercepts
-
increasing intervals
-
decreasing intervals
-
maximums
-
minimums
-
domain
-
range
However, the student exhibits major errors or omissions regarding the more complex ideas and processes.
|
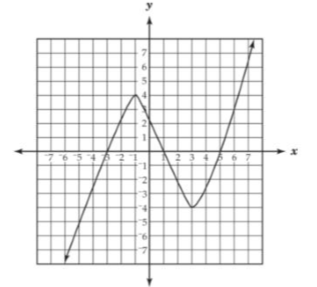
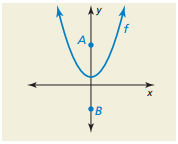
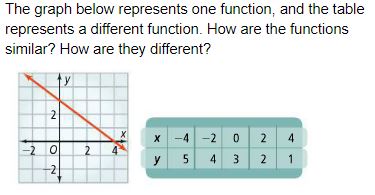
Given the graph, identify all the key features including: x-intercepts, y-intercepts, increasing interval, decreasing interval, maximums, minimums, domain and range. 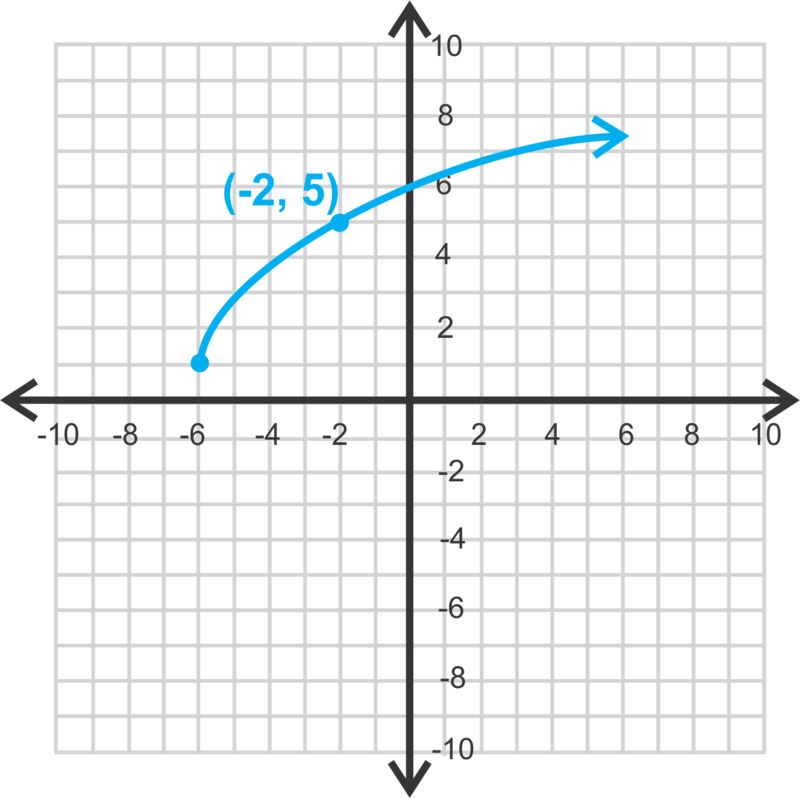
|
|
| |
1.5 |
The student demonstrates partial knowledge of the simpler details and processes (Score 2.0 content) but exhibits major errors or omissions regarding the more complex ideas and procedures (Score 3.0 content). |
|
1.0
(beginning) |
With help, the student demonstrates a partial understanding of some of the simpler details and processes (Score 2.0 content) and some of the more complex ideas and processes (Score 3.0 content). |
|
| |
0.5 |
With help, the student demonstrates a partial understanding of some of the simpler details and processes (Score 2.0 content) but not the more complex ideas and processes (Score 3.0 content). |
| 0.0 |
Even with help, the student demonstrates no understanding or skill. |
|
Alg II Graph Cube Root Functions Proficiency Scale
| Score |
|
Description |
Sample Activity
|
|
4.0
(advanced)
|
In addition to Score 3.0, the student demonstrates in-depth inferences and applications regarding more complex material that go beyond end of instruction expectations. |
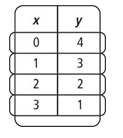
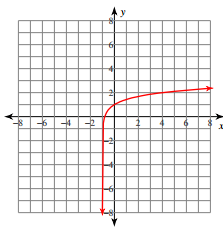
Explain why your graph of  is in both the first and third quadrants? is in both the first and third quadrants?
|
| |
3.5 |
In addition to Score 3.0 performance, the student demonstrates in-depth inferences and applications regarding the more complex content with partial success. |
|
3.0
(proficient)
|
The student can:
- graph cube root functions expressed symbolically and show key features of the graph (graph simple cases by hand and use technology to show more complicated cases).
The student exhibits no major errors or omissions. |
Graph the following equations and identify all the key features including: x-intercepts, y-intercepts, increasing interval, decreasing interval, inflection point, domain and range.  |
|
| |
2.5 |
The student demonstrates no major errors or omissions regarding the simpler details and processes (Score 2.0 content) and partial knowledge of the more complex ideas and processes (Score 3.0 content). |
|
2.0
(progressing)
|
There are no major errors or omissions regarding the simpler details and processes as the student can:
- recognize and recall basic terminology, such as:
-
index
-
radicand
-
radical
-
perfect cubes
-
x-intercepts
-
y-intercepts
-
increasing intervals
-
decreasing intervals
-
inflection point
-
domain
-
range
However, the student exhibits major errors or omissions regarding the more complex ideas and processes.
|
|
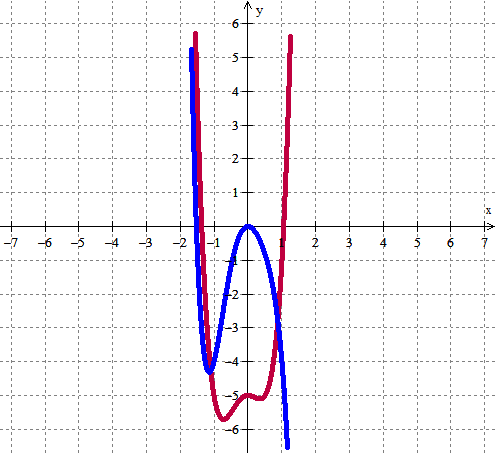
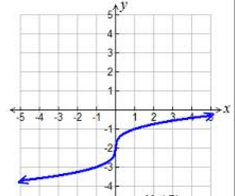
Given the graph, identify all the key features including:
x-intercepts, y-intercepts, increasing interval, decreasing interval, inflection point, domain and range.
|
|
| |
1.5 |
The student demonstrates partial knowledge of the simpler details and processes (Score 2.0 content) but exhibits major errors or omissions regarding the more complex ideas and procedures (Score 3.0 content). |
|
1.0
(beginning)
|
With help, the student demonstrates a partial understanding of some of the simpler details and processes (Score 2.0 content) and some of the more complex ideas and processes (Score 3.0 content). |
|
| |
0.5 |
With help, the student demonstrates a partial understanding of some of the simpler details and processes (Score 2.0 content) but not the more complex ideas and processes (Score 3.0 content). |
| 0.0 |
Even with help, the student demonstrates no understanding or skill. |
|
Alg II Graph Piecewise Functions Proficiency Scale
| Score |
|
Description |
Sample Activity
|
|
4.0
(advanced) |
In addition to Score 3.0, the student demonstrates in-depth inferences and applications regarding more complex material that go beyond end of instruction expectations. |
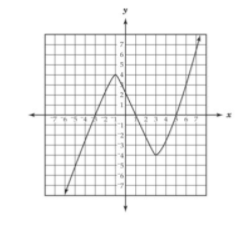
| Write the equation of the following piecewise graph and determine the domain and range of the following graph.
|
| |
|
| |
3.5 |
In addition to Score 3.0 performance, the student demonstrates in-depth inferences and applications regarding the more complex content with partial success. |
|
3.0
(proficient)
|
The student can:
- graph step functions expressed symbolically and show key features of the graph (graph simple cases by hand and use technology to show more complicated cases).
- graph piecewise functions expressed symbolically and show key features of the graph (graph simple cases by hand and use technology to show more complicated cases).
The student exhibits no major errors or omissions. |
Graph the following equations and identify all the key features including: increasing interval, decreasing interval, discontinuity, continuity, domain and range.  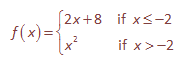
|
| |
2.5 |
The student demonstrates no major errors or omissions regarding the simpler details and processes (Score 2.0 content) and partial knowledge of the more complex ideas and processes (Score 3.0 content). |
|
2.0
(progressing) |
There are no major errors or omissions regarding the simpler details and processes as the student can:
- recognize and recall basic terminology, such as:
-
decreasing intervals
-
increasing intervals
-
discontinuity
-
continuity
-
domain
-
range
However, the student exhibits major errors or omissions regarding the more complex ideas and processes.
|
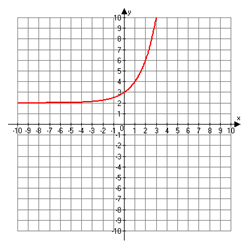
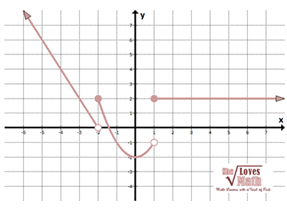
Given the graph, identify all the key features including: increasing interval, decreasing interval, discontinuity, continuity, domain and range. 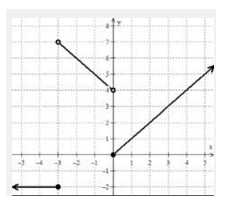 |
|
| |
1.5 |
The student demonstrates partial knowledge of the simpler details and processes (Score 2.0 content) but exhibits major errors or omissions regarding the more complex ideas and procedures (Score 3.0 content). |
|
1.0
(beginning) |
With help, the student demonstrates a partial understanding of some of the simpler details and processes (Score 2.0 content) and some of the more complex ideas and processes (Score 3.0 content). |
- |
| |
0.5 |
With help, the student demonstrates a partial understanding of some of the simpler details and processes (Score 2.0 content) but not the more complex ideas and processes (Score 3.0 content). |
| 0.0 |
Even with help, the student demonstrates no understanding or skill. |
- |
Alg II Graph Absolute Value Functions Proficiency Scale
| Score |
|
Description |
Sample Activity
|
|
4.0
(advanced) |
In addition to Score 3.0, the student demonstrates in-depth inferences and applications regarding more complex material that go beyond end of instruction expectations. |
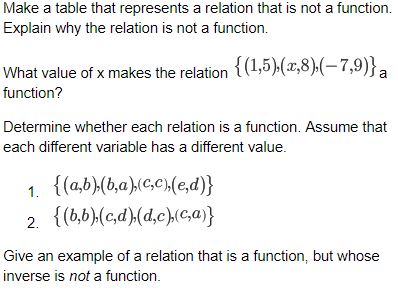
Graph the following function and explain why the graph looks as it does: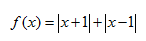
|
| |
3.5 |
In addition to Score 3.0 performance, the student demonstrates in-depth inferences and applications regarding the more complex content with partial success. |
|
3.0
(proficient)
|
The student can:
The student exhibits no major errors or omissions. |
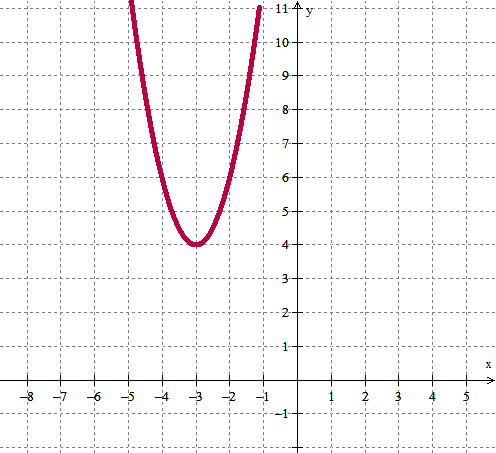
Graph the following equations and identify all the key features including: vertex, x-intercepts, y-intercepts, increasing interval, decreasing interval, maximums, minimums, domain and range. 
|
| |
2.5 |
The student demonstrates no major errors or omissions regarding the simpler details and processes (Score 2.0 content) and partial knowledge of the more complex ideas and processes (Score 3.0 content). |
|
2.0
(progressing) |
There are no major errors or omissions regarding the simpler details and processes as the student can:
- recognize and recall basic terminology, such as:
However, the student exhibits major errors or omissions regarding the more complex ideas and processes.
|
Given the graph, identify all the key features including: vertex,x-intercepts, y-intercepts, increasing interval, decreasing interval, maximums, minimums, domain and range. 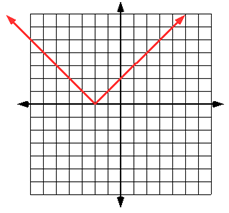 |
|
| |
1.5 |
The student demonstrates partial knowledge of the simpler details and processes (Score 2.0 content) but exhibits major errors or omissions regarding the more complex ideas and procedures (Score 3.0 content). |
|
1.0
(beginning) |
With help, the student demonstrates a partial understanding of some of the simpler details and processes (Score 2.0 content) and some of the more complex ideas and processes (Score 3.0 content). |
|
| |
0.5 |
With help, the student demonstrates a partial understanding of some of the simpler details and processes (Score 2.0 content) but not the more complex ideas and processes (Score 3.0 content). |
| 0.0 |
Even with help, the student demonstrates no understanding or skill. |
|
Resources
|