MAP Resources
| Site: | Learnbps |
| Class: | District Assessment |
| Book: | MAP Resources |
| Printed by: | Guest user |
| Date: | Monday, August 3, 2026, 11:36 AM |
Description
this book is a repository for links to MAP documentation
1. MAP Resources
Click on the chapter links in the left margin to access topics and resources.
2. Norms
-Clicking on these links will open the document in Google Docs. Documents can be printed or downloaded by using the google docs FILE menu.
Norms Documentation
Growth Documentation
Percentile Tables
Math Percentile Charts (by Grade & Testing Season)
Reading Percentile Charts (by Grade & Testing Season)
2.1. School Growth Norms
In 2012, School Norms were established by NWEA that indicate how well a grade level within a school has performed relative to other districts across the country.
The norming group for this study included over 1000 schools across the country that participate in NWEA MAP assessments.
It is recommended that you watch this five minute video on how this works.
Links and Resources:
New Reports site logon portal
- Contact Jennifer Weber if you need assistance with your NWEA username/password
How to print the Student Growth Summary Report
2012 School Norms User's Guide
- This is an excel file in a zip format. Download to your computer, unzip, and then save to your computer.
School Norms page at NWEA
2.2. Norms Methodology
Click HERE to view a series of short videos that explains 2011 NWEA norms methodology.
Documentation - these documents will open in google docs. Use the FILE menu in google docs to Print or Download a copy.
3. Accessing test results
Student test data can be accessed via the NWEA Reports site, and in Viewpoint.
The Username for the NWEA Reports site is your FULL EMAIL ADDRESS. If you have forgotten your password, you can retrieve it from the system by going to the logon page and clicking on the FORGOT USER NAME/PASSWORD link. The system will send you your username and a temporary password within ten minutes, and you can use that info to log into the system and establish a new password.
Users can log into Viewpoint using their regular district username and password.
Documentation
Printing Reports from NWEA website - includes printing teacher reports; individual student reports; and Class by RIT
Printing Student Reports with Graphs - this is the report often shared with parents at conferences
MAP Reports Guide - a list of available reports with annotations
3.1. ASG Reports
ASG Reports are a measure of Achievement Status and Growth. These are classroom level reports, that indicate how many students made expected growth, as well as the percentage of overall growth achieved by class.
Note: Student scores will show in this report the day AFTER they have been tested.
To PRINT the ASG Report:
| 1. Log into the MAP Reports site | |
|
2. Click on the VIEW REPORTS & INSTRUCTIONAL RESOURCES 3. From the expanded list, click on MAP REPORTS. |
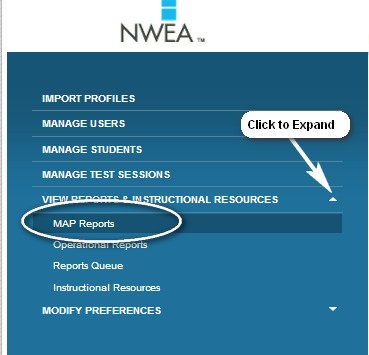 |
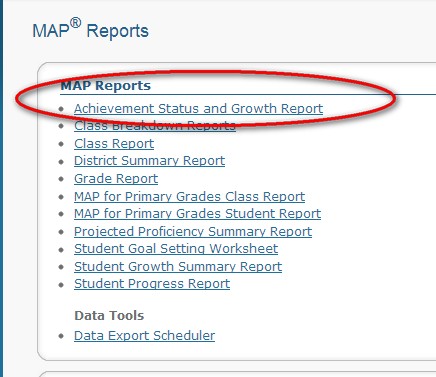
| 4. The Reports page will open. From the section labeled MAP REPORTS, select the first bullet labeled ACHIEVEMENT STATUS AND GROWTH REPORT. |
 |
|
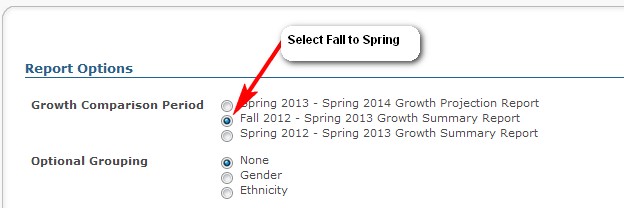
5. Select the appropriate Term and Class, and also mark the bullet 6. Click the CREATE REPORT button. The report will be sent to the REPORT QUEUE. |
 |
| It will take a few minutes for each ASG report to generate. You can return to the Reports Queue later to retrieve the report. The Report Queue is located under the same expanded menu as shown in steps 2 & 3. |
|
Click HERE for an annotated ASG Report that explains the various report parts.
5. Common Core MAP
BPS switched from state aligned version of MAP to Common Core MAP in Fall 2012.
6. Lexiles
MAP reading assessments produce a Lexile reading level for each student. This page contains links and information regarding Lexile.
*Note: A lexile measure of BR designates a beginning (or emerging) reader. Students measured at this level are not yet independent readers.
Lexile Website - use this site to access additional lexile information; the book lexile database; or to use online tools to determine the lexile level of a text.
6.1. Common Core and Lexiles
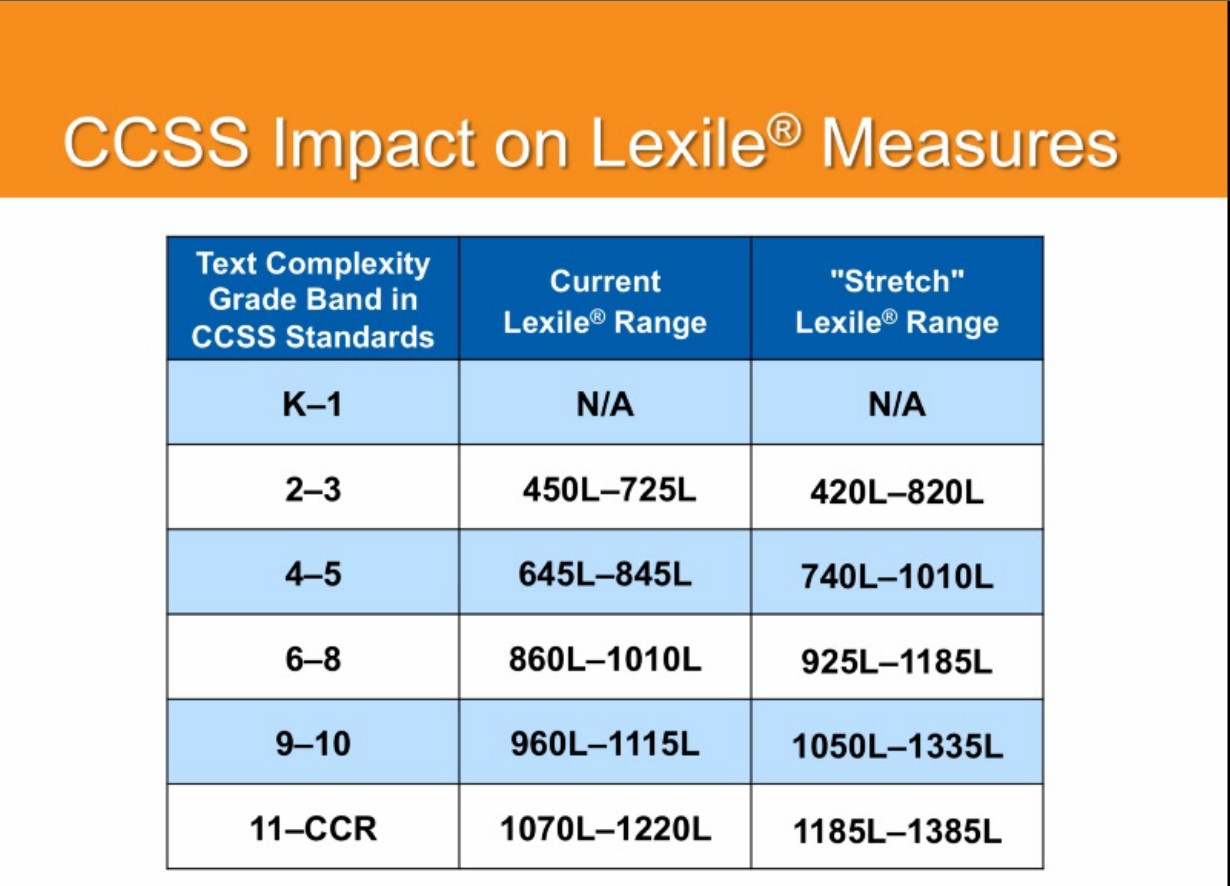
The move to Common Core will not change the current normed lexile levels of students by grade level. What will change, is the expectation of where the student lexile level should be. There is an unstated expectation that the implemenation of Common Core standards will result in increased normed lexile levels for students.
Below is a table that show the expected Lexile ranges by grade level based on the implementation of Common Core standards.
7. Goal Setting with Students
NWEA MAP Reports site contains reports to assist in setting growth goals with students. An overview of the goal setting process can be viewed HERE.
8. Moving students to higher MAP tests
Generally, as students move through BPS they are given the MAP assessment that reflects their grade level. NWEA has three levels of tests for each subject area. In order of most primary to most difficult, the levels are:
- Primary
- 2-5
- 6+
Sometimes student achievement level creates the question of whether it may be more appropriate to move a student up to a higher version of the MAP assessment. When considering whether to move a student from the test recommended for their grade level to a higher version of MAP, a four-point criteria should first be considered:
- (For movement from MAP Primary to MAP 2-5), is the student an independent reader, capable of reading short passages fluently and making sense of what they read?
- Is the student consistently scoring (at least two prior testing seasons) high test scores that are at the 95th percentile or better?
- Has the student been exposed to some of the content that will be measured on the higher MAP test?
- Is the classroom teacher comfortable with the idea of assessing the student at a higher level than the rest of the class?
See also LOS Selection and Topping Out the Test chapters (located in the table of contents in the right margin of this page).
8.1. Topping out the Test
Click HERE for printable document on Topping out the MAP Test.
8.2. LOS Selection Guidelines
Below are the minutes from the 1/12/2011 LOS meeting, cut and pasted here from the LOS Moodle. The minutes provide guidelines for LOS staff when deciding which MAP test should be administered to LOS students.
Minutes from Jan. 10, 2011
Present: Bob, Andrea, Dana, Londa, Kim, Michelle, Michelle, Kathy, and Heidi and Jen Weber
MAP conversation
Below are the ranges of RIT scores that are tested on each test:
Primary MAP tests range: 0 - 215 RIT
2-5 MAP range rdg: 160 - 260 RIT
2-5 MAP range math: 160 - 240 RIT
6+ MAP range rdg: 160 - 260 RIT
6+ MAP range math: 160 - 270 RIT
At 215 the students begin to max out the difficulty of the questions.
This fall we had suggested MAP Reading 207 or higher take 2-5 test.
Discussed including the emotional readiness of second graders. Do we really need to push the more challenging tests for the data, or can we allow youngsters to be youngsters, allowing a successful testing experience?
The district has made a decision to keep second graders on the Primary tests through the entire year. Exceptions can be made on a case-by-case basis.
2-5 grade reader will only see passages of 100 words or less on the 2-5 MAP reading test.
Previously we had agreed that 5th graders scoring 239 or higher on MAP Math should take the 6+ Math MAP test in order to receive the algebra and geometry questions not offered on the 2-5 test. This data is helpful for our LOS students.
Andrea questioned what to do with young students who scored over 215 already on their MAP Primary, which means they maxed out the level of questions offered on the Primary test. She feels her students are ready for the challenge of the 2-5 test, considering their attention span for testing periods.
These numbers and conversations will hold true for any testing period - fall, winter, spring. However, caution should be used if you want to advance a student for the fall test.
Mr. Olson asked about testing outside the window. This score would not be ever recorded on the NWEA or Viewpoint. This would be an option for getting more data after the window had closed. It would also allow you to see how the test would work for students.
You could also test outside the window for students who are new to our district to help determine if a student should receive LOS services.
9.1. Finding Suspended tests by School (generic)
9.2. Finding Suspended Tests or Students not Tested (Elem)
Finding Students with Suspended Tests or who have not Tested
(*Note: Weber can generate a building wide report called "Students Without Valid Test Scores". If you want Weber to generate this report for your school, email or call her with the request)
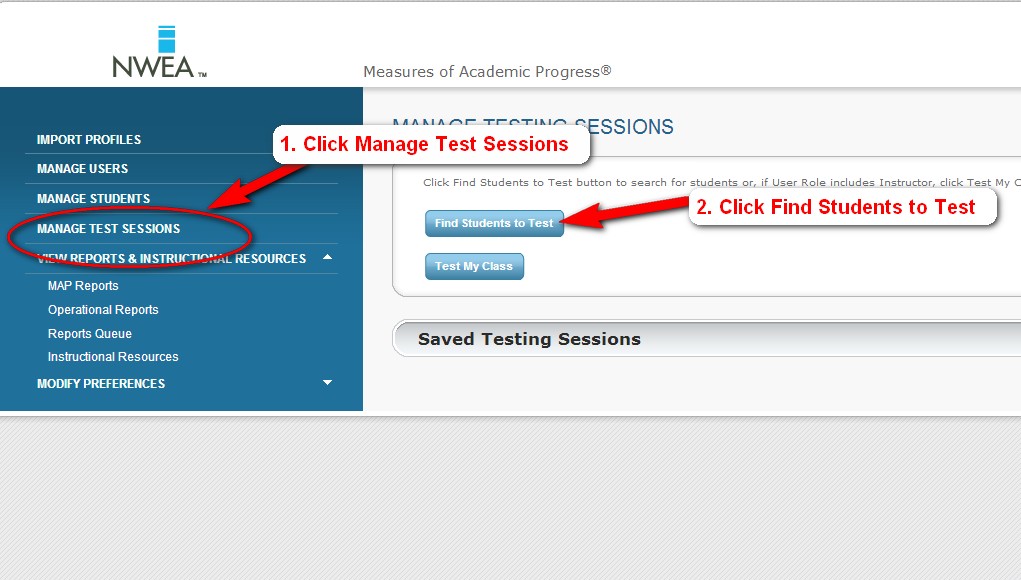
- From the left margin menu, select Manage Test Session, then click the Find Students to Test button (see image 1).
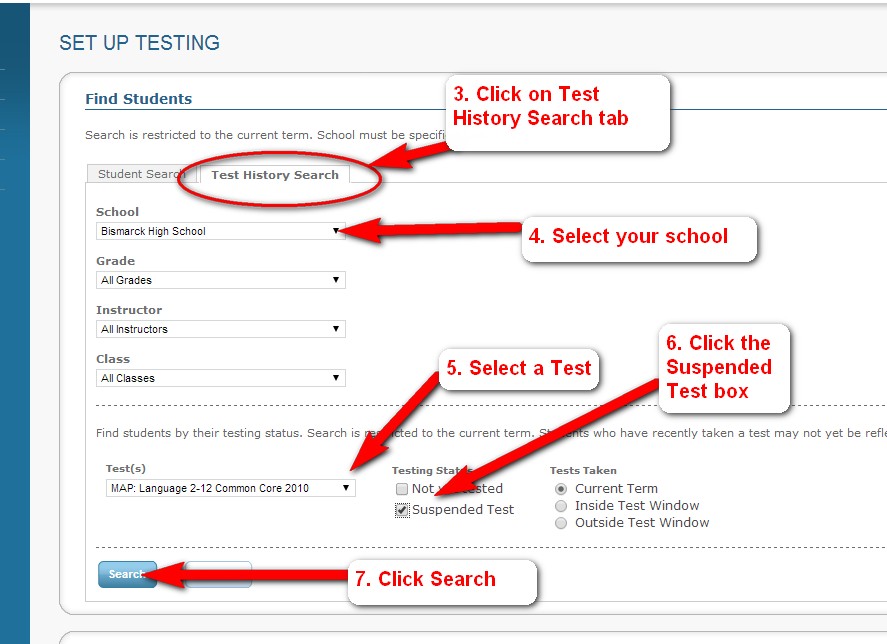
- Click on the Test History Search tab, and select your school and the desired grade/class from the drop down boxes (see image 2)
- In the bottom section, select the test you want to query, and check the box next to Suspended Tests and/or Not Yet Tested. (see image 2)
- Click Search
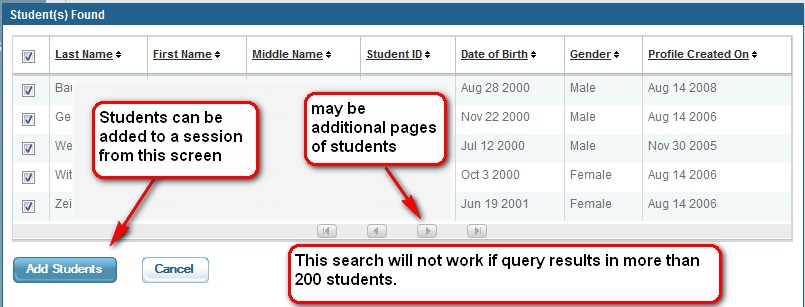
- A list of students with suspended tests will generate (see image 3)
IMAGE 1

IMAGE 2
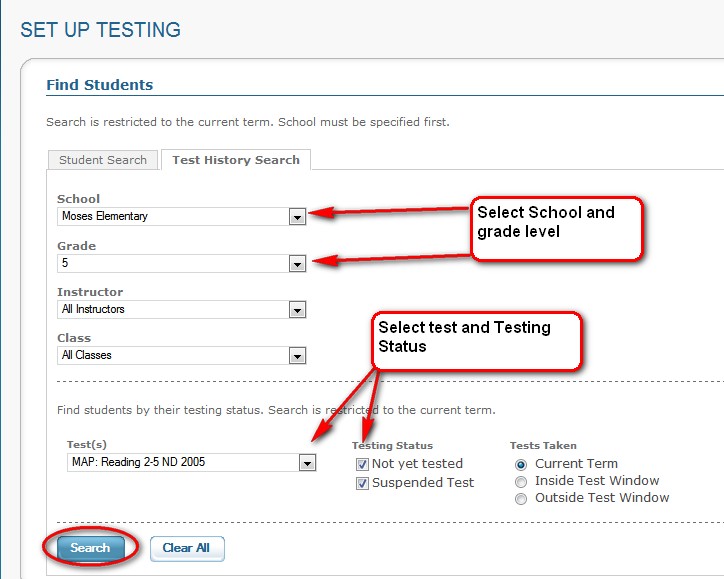
IMAGE 3
9.3. Finding Students with Suspended Tests (Secondary)
Finding Students with Suspended Tests
- From the left margin menu, select Manage Test Session, then click the Find Students to Test button (see image 1).
- Click on the Test History Search tab, and use the drop down boxes to select the group of students you want to query (see image 2)
- In the bottom section, select the test you want to query, and check the box next to Suspended Tests. (see image 2)
- Click Search
- A list of students with suspended tests will generate (see image 3)
IMAGE 1
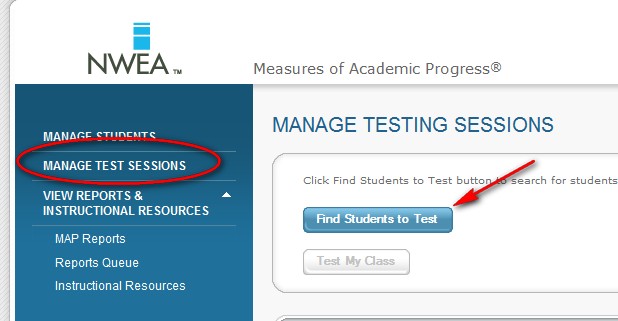
IMAGE 2
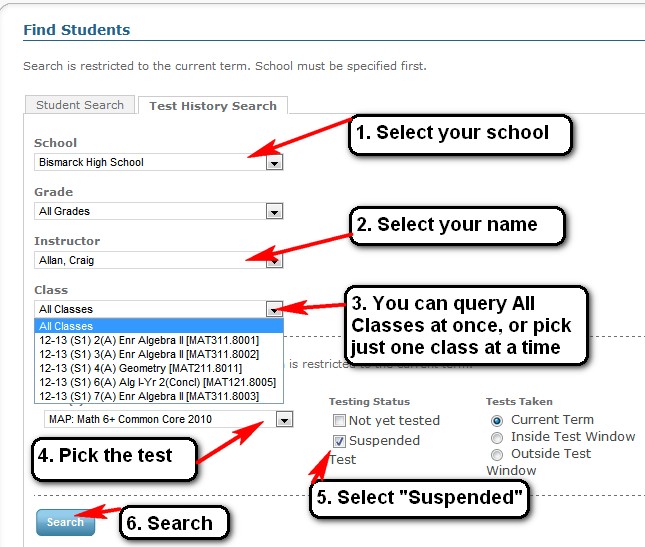
IMAGE 3

9.4. Test Retakes
Student Test Retakes
There are a number of reasons why it may be appropriate for a student to retake a MAP test. Some of these reasons include:
- Student did not try his or her personal best
- Student became ill during testing
- Student because distracted during testing
- Unusual test conditions or environmental distractions
- Test was not administered properly for a student on an IEP
- Student showed a negative growth of eleven points or more
A student may take a test more than once during a testing window.* When a student retakes a test, the system will determine which test is valid using the following criterium:
- The test with the lowest standard error of measure (SE) will be the valid test event, regardless of the student RIT score.
Please note that when a student is retested, the higher RIT score is only valid if it also has the lower standard error of measure. Also note that the valid test is is selected automatically by the system any time that a student is retested.
**Retest Warning - Over testing produces less valid test scores!**
The MAP assessments are designed so that when a student has a test item during a test event, that item is flagged and will not appear again for that student for a three year time frame. Overtesting a student (testing more than twice in a testing period, or testing twice over the course of multiple testing periods) can deplete the items available to that student in the test bank. This practice makes it progressively more difficult to get a valid score for that student.
While teachers have the ability to retest at any time, retesting should be done with caution.
9.5. Determining Test Validity
There is a report in Viewpoint called MAP Validity (located under Assessment Reports) that can be used to determine whether a specific test even was valid for an individual student. This report will show data for three variables - test standard error, test duration, and percent of questions answered correctly - for each student in the report. When analysis reveals one or more of these variables to be an outlier, this provides evidence that the test session for that student was not necessarily valid.
To run the report:
- Log into Viewpoint
- Select a class, grade, or group of students.
- Under the Assessment Reports section, click on MAP Validity.
- Pick the term and category (subject area)
- Generate the report
The image below provides some guidance in terms of what to look for when viewing this report.

9.6. Negative Growth
NWEA addresses negative RIT growth here.
9.7. Test Invalidations
Student Test Invalidations
An invalidation occurs when the testing system nullifies a test event, or when the District MAP Coordinator tells the system to ignore a test event.
An invalidation that occurs automatically by the system can be caused for a variety of reasons. A summary of system invalidations can be found here.
A score invalidated by the system will appear "greyed out" in the online reports.
How to Manually Invalidate a Student Test Score
A manual invalidation can only be performed at the district level. In all cases, the request must come through the building principal to the District MAP Coordinator . The request needs to include enough information (student name, test name, test date or RIT score) so that the test even can be located in the system. The invalidation is immediate after the score has been invalidated at the district level.
All manual invalidation requests will be documented by the Assessment Department. Information documented will included name of staff requesting invalidation, approving principal, and date of invalidation.
9.8. Testing Accomodations
MAP Accommodations
The standard procedure for students on IEP’s is NOT to pull them out of the regular classroom for MAP assessment. Rather, they should remain with classmates in the regular education setting using needed *accommodations listed below.
- Math manipulatives (used independently by student)
- Directions repeated
- Marker or ruler to keep place
- “Secretary” provided for the students with fine motor disability (i.e. switch users, tactile defensiveness, limited tolerance levels)
- Extended completion time for tests
- Calculator for allowable problems
- Alternate setting
- Multiple, shortened timeframes for test item completion
- Appropriate seating
- Appropriate screen placement
- Appropriate mouse placement
- Oral reading of math problems
- Student repeats directions
- Braille, embossing, or enlarged print
- Sensory accommodations (i.e. assistive listening devices or amplification, hearing aids, telex)
- Communication device to indicate responses (to scribe)
- Student reads test items aloud
- Alternate mouse/ mouse pointer
*Any accommodations used should align with those noted on the student’s IEP, which are used on a daily/ routine basis.
Revised 9/09 bj//bismarck public schools
10. Training/Tutorials
Training/Tutorials
There are two short online tutorials available for proctors to familiarize themselves with or review the proctoring process. The tutorials can be found on the web-MAP report site:
1. Log into the web-MAP reporting site.
2. On the main (Home) page, locate the section labelled Online Training, and click the link for Essential Preparation for using MAP.
- The Proctor Quick Start video (6 min) will explain the overall process of how testing works and how to create a test session.
- The Proctor Tools video (11 min) gives further instructions for pausing, suspending, and terminating test sessions.
- The Proctor Tips and Troublshooting sheet is a pdf document that can be printed and used for reference while testing.